Analyzing raw network traffic used to feel like trying to decipher matrix code until specialized tools made inspecting packet data manageable. Learning how to use Wireshark for beginner security tasks gives you total visibility into what is moving across your local interface. You can track down misconfigured devices, detect hidden malware beacons, or troubleshoot dropped connections without relying on high-level log summaries.
Getting Started With Your First Live Capture
Setting up your environment takes under five minutes on Windows, macOS, or Linux systems. Head over to the official download page and retrieve the appropriate installer for your platform. During setup, ensure you check the box to install Npcap, as missing this driver stops your network card from intercepting local traffic properly.
Launching the application presents you with the main dashboard listing every active network card on your rig. Look for the interface displaying an active traffic sparkline graph, which usually corresponds to your main connection. Double-clicking that active interface or clicking the blue shark fin icon in the top left instantly starts recording live packet activity.
Once you have gathered enough sample data, click the red square icon on the top toolbar to halt the recording process. Generating traffic by loading a standard website while capturing gives you plenty of real packets to analyze. Saving these trace files lets you review raw frame activity offline whenever necessary.
Understanding the Interface Dashboard Layout
When you stop your capture, the main screen populates with a massive amount of technical information split across three main windows. Learning how to read each section prevents visual fatigue and helps you pinpoint relevant network events rapidly.
Decoding the Chronological Packet List
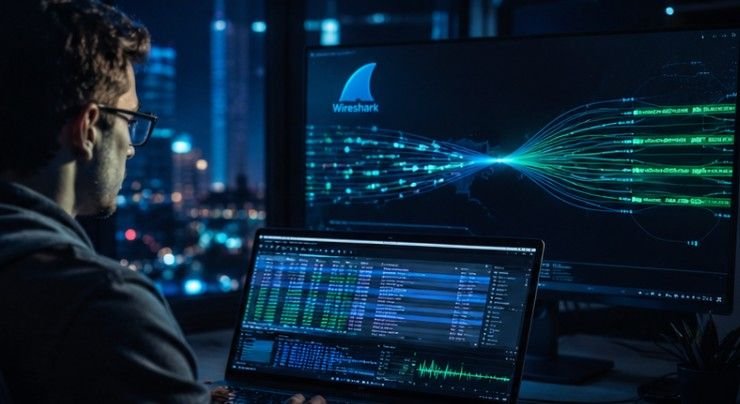
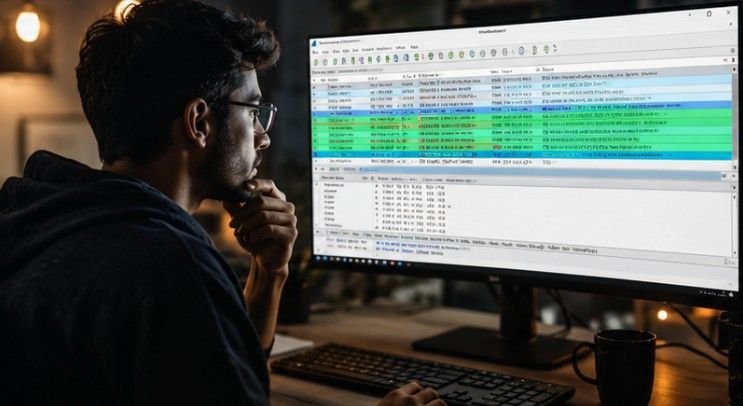
The top section is the Packet List pane, displaying every captured frame in chronological order. Each row represents a single data packet moving across your network interface. Columns display critical parameters including packet sequence numbers, precise timestamps, source IP addresses, destination IP addresses, underlying protocols, and frame lengths.
Color coding helps separate traffic types quickly, such as green for TCP connections or dark blue for DNS queries.
Inspecting Layers in the Packet Details Pane
Selecting any individual packet row in the top window automatically updates the Packet Details pane located in the middle. This area breaks down the selected frame layer by layer according to standard networking protocols.
You can expand drop-down menus to inspect physical Ethernet addresses, IP header options, or TCP handshake flags. This detailed view allows you to verify exact communication parameters between endpoints.
Examining Hexadecimal Data in the Packet Bytes Window
The bottom pane shows the Packet Bytes view, presenting raw data in side-by-side hexadecimal and ASCII text formats. Highlighting a field in the middle details window automatically highlights the corresponding byte range at the bottom.
Security analysts frequently inspect these raw bytes to identify plain text passwords, examine custom payload headers, or inspect file contents transferred over unencrypted channels.
Filtering Traffic to Cut Through Network Noise
Because live captures record every background process on your machine, the resulting file can quickly become overwhelming. Learning how to use Wireshark for beginner search tasks involves applying display filters in the top search bar to isolate targeted traffic.
Isolating Traffic by Target IP Address
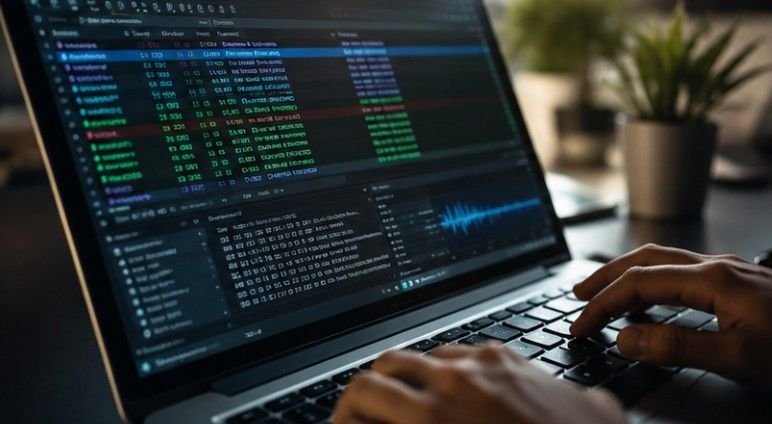
Filtering by IP address allows you to track all communications associated with a specific host. Typing ip.addr == 192.168.1.1 into the filter bar isolates every frame sent from or destined to that device. If you want to view traffic coming strictly from your own workstation, you can narrow the search by specifying source parameters like ip.src == 192.168.1.50.
Narrowing Results by Network Protocol
Filtering by protocol type lets you focus exclusively on specific communication protocols while ignoring background noise. Entering dns into the filter bar reveals every domain name lookup query performed by your machine. Similarly, typing http isolates standard web requests, allowing you to examine web server interactions without wading through thousands of encrypted background streams.
Inspecting Specific Application Ports
Port-based filters help you monitor services operating on non-standard network locations. Entering tcp.port == 443 displays all encrypted web browsing traffic passing through the standard HTTPS port. Using port syntax allows security teams to verify whether applications are using expected communication channels or attempting unauthorized connections over open ports.
Best Practices for Master Packet Inspection
Adopting systematic workflows early on saves huge amounts of time during live incident responses or forensic investigations.
Differentiating Capture Filters From Display Filters
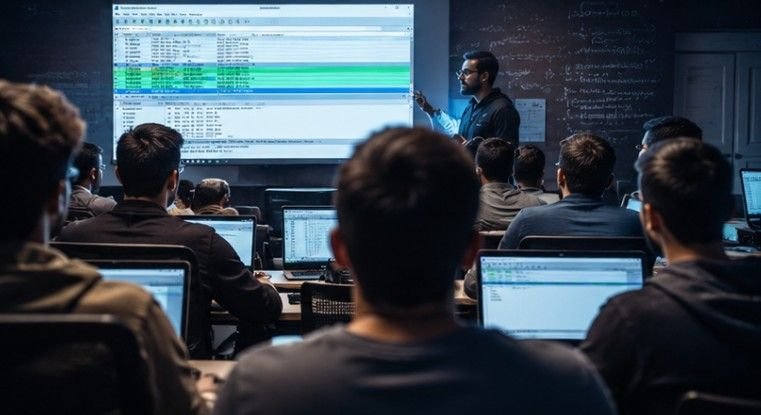
Understanding when to apply capture filters versus display filters is crucial for managing system resources. Capture filters are applied before recording begins, limiting what data gets written to disk and preventing giant capture files. Display filters operate on data that has already been saved, letting you search through full traces without permanently throwing away background packets.
Reconstructing Full Conversations With TCP Streams
Raw packet lists present data as disconnected individual frames, making it tough to read complete messages. Right-clicking any TCP packet and selecting the option to follow the TCP stream opens a dedicated pop-up window displaying the entire plain text conversation. Client requests appear in one color while server responses appear in another, making unencrypted data easily readable.
Safe Hands-On Learning With PCAP Files
Practicing packet analysis on live networks without prior experience can feel confusing due to unpredictable background traffic. Downloading pre-recorded trace files ending in .pcap from public repositories allows you to study real malware behavior and network anomalies safely. Analyzing sample traces lets you hone your threat hunting skills in a controlled, risk-free environment.
Frequently Asked Questions
1. What is the main purpose of using Wireshark?
Wireshark captures and inspects live network traffic down to the individual packet level, helping administrators troubleshoot network issues, inspect protocol implementations, and analyze potential security threats.
2. Is learning how to use Wireshark difficult for absolute beginners?
While the main dashboard presents a vast amount of technical detail, learning basic interface navigation, simple display filters, and stream tracking makes the tool highly accessible for complete beginners.
3. Can Wireshark capture traffic from other devices on my network?
Yes, Wireshark can capture promiscuous traffic across your local broadcast domain, though inspecting traffic on modern switched networks typically requires setting up port mirroring or network taps.
4. Why does my display filter bar turn red when typing commands?
The filter bar turns red whenever there is a syntax error or incomplete command in your filter expression, automatically changing back to green once you enter valid syntax.
Your First Deep Dive Into Packets
Mastering how to use Wireshark for beginner investigations converts complex network activity into clear, actionable visual insights. Learning to navigate interface panes, write display filters, and reconstruct streams gives you complete visibility across local subnets. Grab a sample trace file, start filtering through packet layers, and watch your technical troubleshooting skills grow rapidly.